

As a former CFP / investment advisor / stockbroker, I can tell you that on average, people make poor investment choices, and most people underperform the market as a whole. But there are some promising strategies that backtest well that could smooth out investment return highs and lows, increasing average return while decreasing risk in the process.
Disclaimer: take nothing in this post as investment advice. This is just something I did as a proof of concept. Never take investment advice from internet strangers, past performance is not indicative of future results, diversify your portfolio, seek professional advice, yadda yadda.
If you try to time the market, you'll probably get burned. You'll suck at it. You'll buy and sell at the wrong times, and hindsight will prove that you should've just invested in an index fund and let your money ride. You can't beat the market over the long-term and you shouldn't even try. This current market is no exception: the Dunning-Kruger effect is in full view and there will be wailing and gnashing of teeth when the ride comes to a full and complete stop. But there is a strategy that has worked well over time, provided that you're disciplined in its execution.
The premise of the strategy is that things trending downward tend to continue trending down, and things trending upward tend to continue trending upward. The objective then is to define a point where the trend breaks and switch your investments after the break is confirmed. One way to confirm a trend breaking is to compare a market index's moving average with its current price. If the current price dips below the moving average, sell; if the current price breaks above the moving average, buy. Of course, if you buy and sell every time the index price crosses the moving average, you'll end up doing a lot of buying or selling. An alternative to smooth out some of those breaks is to compare a shorter-period moving average with a longer period.
Without diving into all the figures from backtesting the market over the past 100 years, I'll cut to the chase and state my objective: with the percentage of my money allocated to US markets, I plan to sell the S&P 500 Index when the 20-day simple moving average (SMA) breaks down below the 200-day SMA, and buy T-bonds with the proceeeds. When the 20-day SMA breaks through the 200-day SMA on the up side, I'll sell the T-bonds and buy the S&P 500.
Easy enough. Now I just need to know when the 20-day SMA crosses the 200-day SMA. And surprise, I couldn't find a suitable alert through E-trade or Schwab. Simple price alerts, e.g. "alert me when stock ABC's price drops by 15%" or "drops below my target price" are everywhere; but I couldn't find any service that seeks to provide alerts based on published investment strategies. So I created a simple one via Google Sheets.
Using Google Sheets, the below formula will gather one year of closing prices. You can find an explanation of all the attributes here.
=googlefinance(".inx", "price", TODAY()-365, TODAY(), "DAILY")
Then add a 20-day SMA column (column C for me) and a 200-day SMA column (column D for me). In C21 add the below and fill down.
=AVERAGE(C2:C21)
In D201 add the below formula and fill down.
=AVERAGE(D2:D21)
The two primary points to define are when the 20-day SMA crosses above or below the 200-day SMA. So the possible states are:
I only want to be alerted on the day that the SMA cross the threshold, not subsequent days, so I also need to compare the current day's state to the prior day's state. So the evaluations are:
Simplified and using nested IF statements, the pseudo-logic is:
if(20d SMA < 200d SMA, if(cell above = "HOLD", then "SELL", else "TBOND"), if(cell above = "TBOND", then "BUY", else "HOLD"))
Because there is a comparison to the row above, you'll need to enter that first value manually. If today's 20-day SMA is below the 200-day SMA, enter "TBOND" in E200. It's July 2021 as I write this and there is no downtrend, so I entered "HOLD" in E200. Then enter the final formula in E21 and fill down. Using my cell references, that formula is:
if(c201 < d201, if(e200="HOLD", "SELL", "TBOND"), if(e200="TBOND", "BUY", "HOLD"))
Updating the moving averages involves adding a new row each day, querying for the closing price of the S&P 500 index, and then filling down the moving average formulas. And because you want to do this automatically, you'll want to create a scheduled macro to perform this task.
That will give you the shell of the macro that you can use to edit for your daily run. The return values of the GOOGLEFINANCE formula change based on its attributes. If you request historical data or the closing price of the index, it will return an array of values, with the first row containing headers. If you want to extract the date and price, you would need to select them based on array position using the INDEX function. However, if we simplify the use case slightly, we can make it easier and less error-prone.
If we query only for real-time prices, the GOOGLEFINANCE formula will return the price only. By assuming that the macro will run once daily after close of business, we can query for the "real-time price," which will actually be the price at close of business. So all we need to do then is add today's date to the macro.
Select Tools --> Script Editor to see macros associated with your sheet and find these lines:
spreadsheet.getCurrentCell().getNextDataCell(SpreadsheetApp.Direction.DOWN).activate();
spreadsheet.getCurrentCell().offset(1, 0).activate();
And then add this immediately below those lines:
var today = Utilities.formatDate(new Date(),Session.getScriptTimeZone(),'MM/dd/yyyy');
spreadsheet.getCurrentCell().setValue(today)
Finally, you'll need to replace the GOOGLEFINANCE function you entered earlier, because you want the value returned by the function and not the function itself.
spreadsheet.getCurrentCell().setFormulaR1C1('=googlefinance(".inx", "price")');
var latestPrice = spreadsheet.getCurrentCell().getValue();
spreadsheet.getCurrentCell().setValue(latestPrice);
=index(Sheet1!E200:E, COUNTA(Sheet1!E200:E))
=ifs(C2="BUY", "SEND", C2="SELL", "SEND", C2="HOLD", "DON'T SEND", C2="TBILL", "DON'T SEND")
Finally you need to add a function to generate and send the email from Sheets. Select Tools --> Script Editor to see macros associated with your sheet and add this function:
function checkAlertStatus() {
    var spreadsheet = SpreadsheetApp.getActive();
    var sendIndicator = spreadsheet.getSheetByName("Sheet2").getRange("D2");
    if(sendIndicator.getValue() == "SEND") {
        var emailRange = spreadsheet.getSheetByName("Sheet2").getRange("B2");
        var emailAddress = emailRange.getValue();
        var disposition = spreadsheet.getSheetByName("Sheet2").getRange("C2");
        var message = 'Moving average alert. 20-day moving average crossed 200-day moving average: ' + disposition.getValue();
        var subject = '20d MVA crossed 200d MVA';
        MailApp.sendEmail(emailAddress, subject, message);
      }
};
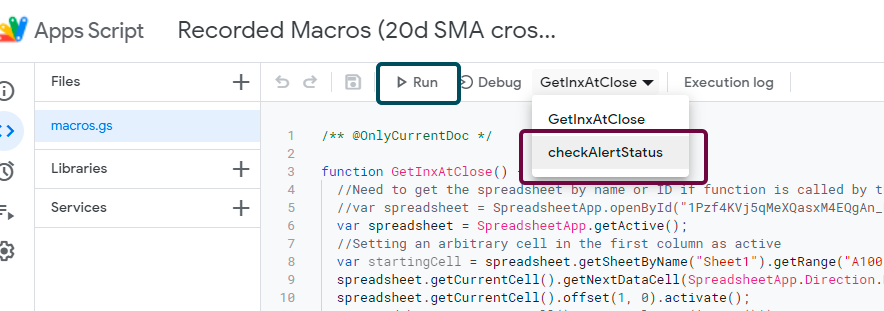
Once you create the alert function, you need to give it permissions to run under your account. This is a multi-step procedure that's made much easier by just running the function and responding to prompts. In the function drop-down menu, select the checkAlertStatus() function and then press the Run button to test your function. If there are errors, you'll be prompted to resolve them, but otherwise, the function will run and Google will prompt you to acknowledge all the permissions you need to enable so that the function can run under your account.
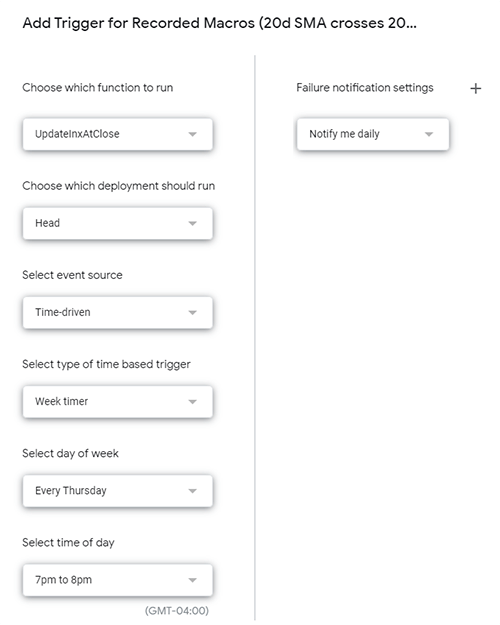
The only thing left to do is schedule your functions to run daily. Unfortunately, Google doesn't have an option to execute functions on each workday or each market open day (unless you want to add your own custom calendar), so you'll need to add a trigger for each weekday to run the moving average function. The alert function can run daily because it will only ever take action on days when teh threshold is crossed, so worse case scenario is you'll get alerts a couple days in a row to buy or sell.
An obvious shortcoming is that on weekdays when the market is closed, the moving average function will still run and the moving average will be updated. One day at a time the moving average will get out of sync with reality, but it should still be close enough for my purposes. This is a quick and dirty solution to something I plan to address in a more robust manner soon anyway.
To set your triggers, hover over the Clock icon in the lefthand navbar and select "Triggers." Then click the "+ Add Trigger" button at the bottom of the page to define your new trigger. You'll want to set a daily trigger for checkAlertStatus(), and then set individual weekly triggers (one on each Monday, one on each Tuesday, etc.) for the GetInxAtClose() function. Make sure that the GetInxAtClose() runs before checkAlertStatus() or there will be a one-day delay in your alert.
Ihave heard there are troubles of more than one kind. Some come from ahead, and some come from behind. But I've brought a big bat. I'm all ready, you see. Now my troubles are going to have troubles with me!
- Dr. Seuss

Hi, Shaun here. No, not the soccer player. And not the children's performer. Just me, a 40-something father of two, residing in Raleigh, NC, where the summer heat has me questioning my life choices.
I try lots of things. I'm okay at some of them. My hobby is collecting hobbies. I drink a lot of coffee. I'm susceptible to ear worms. I throw myself into the things I love. I can't wait for the weekend.